Projects

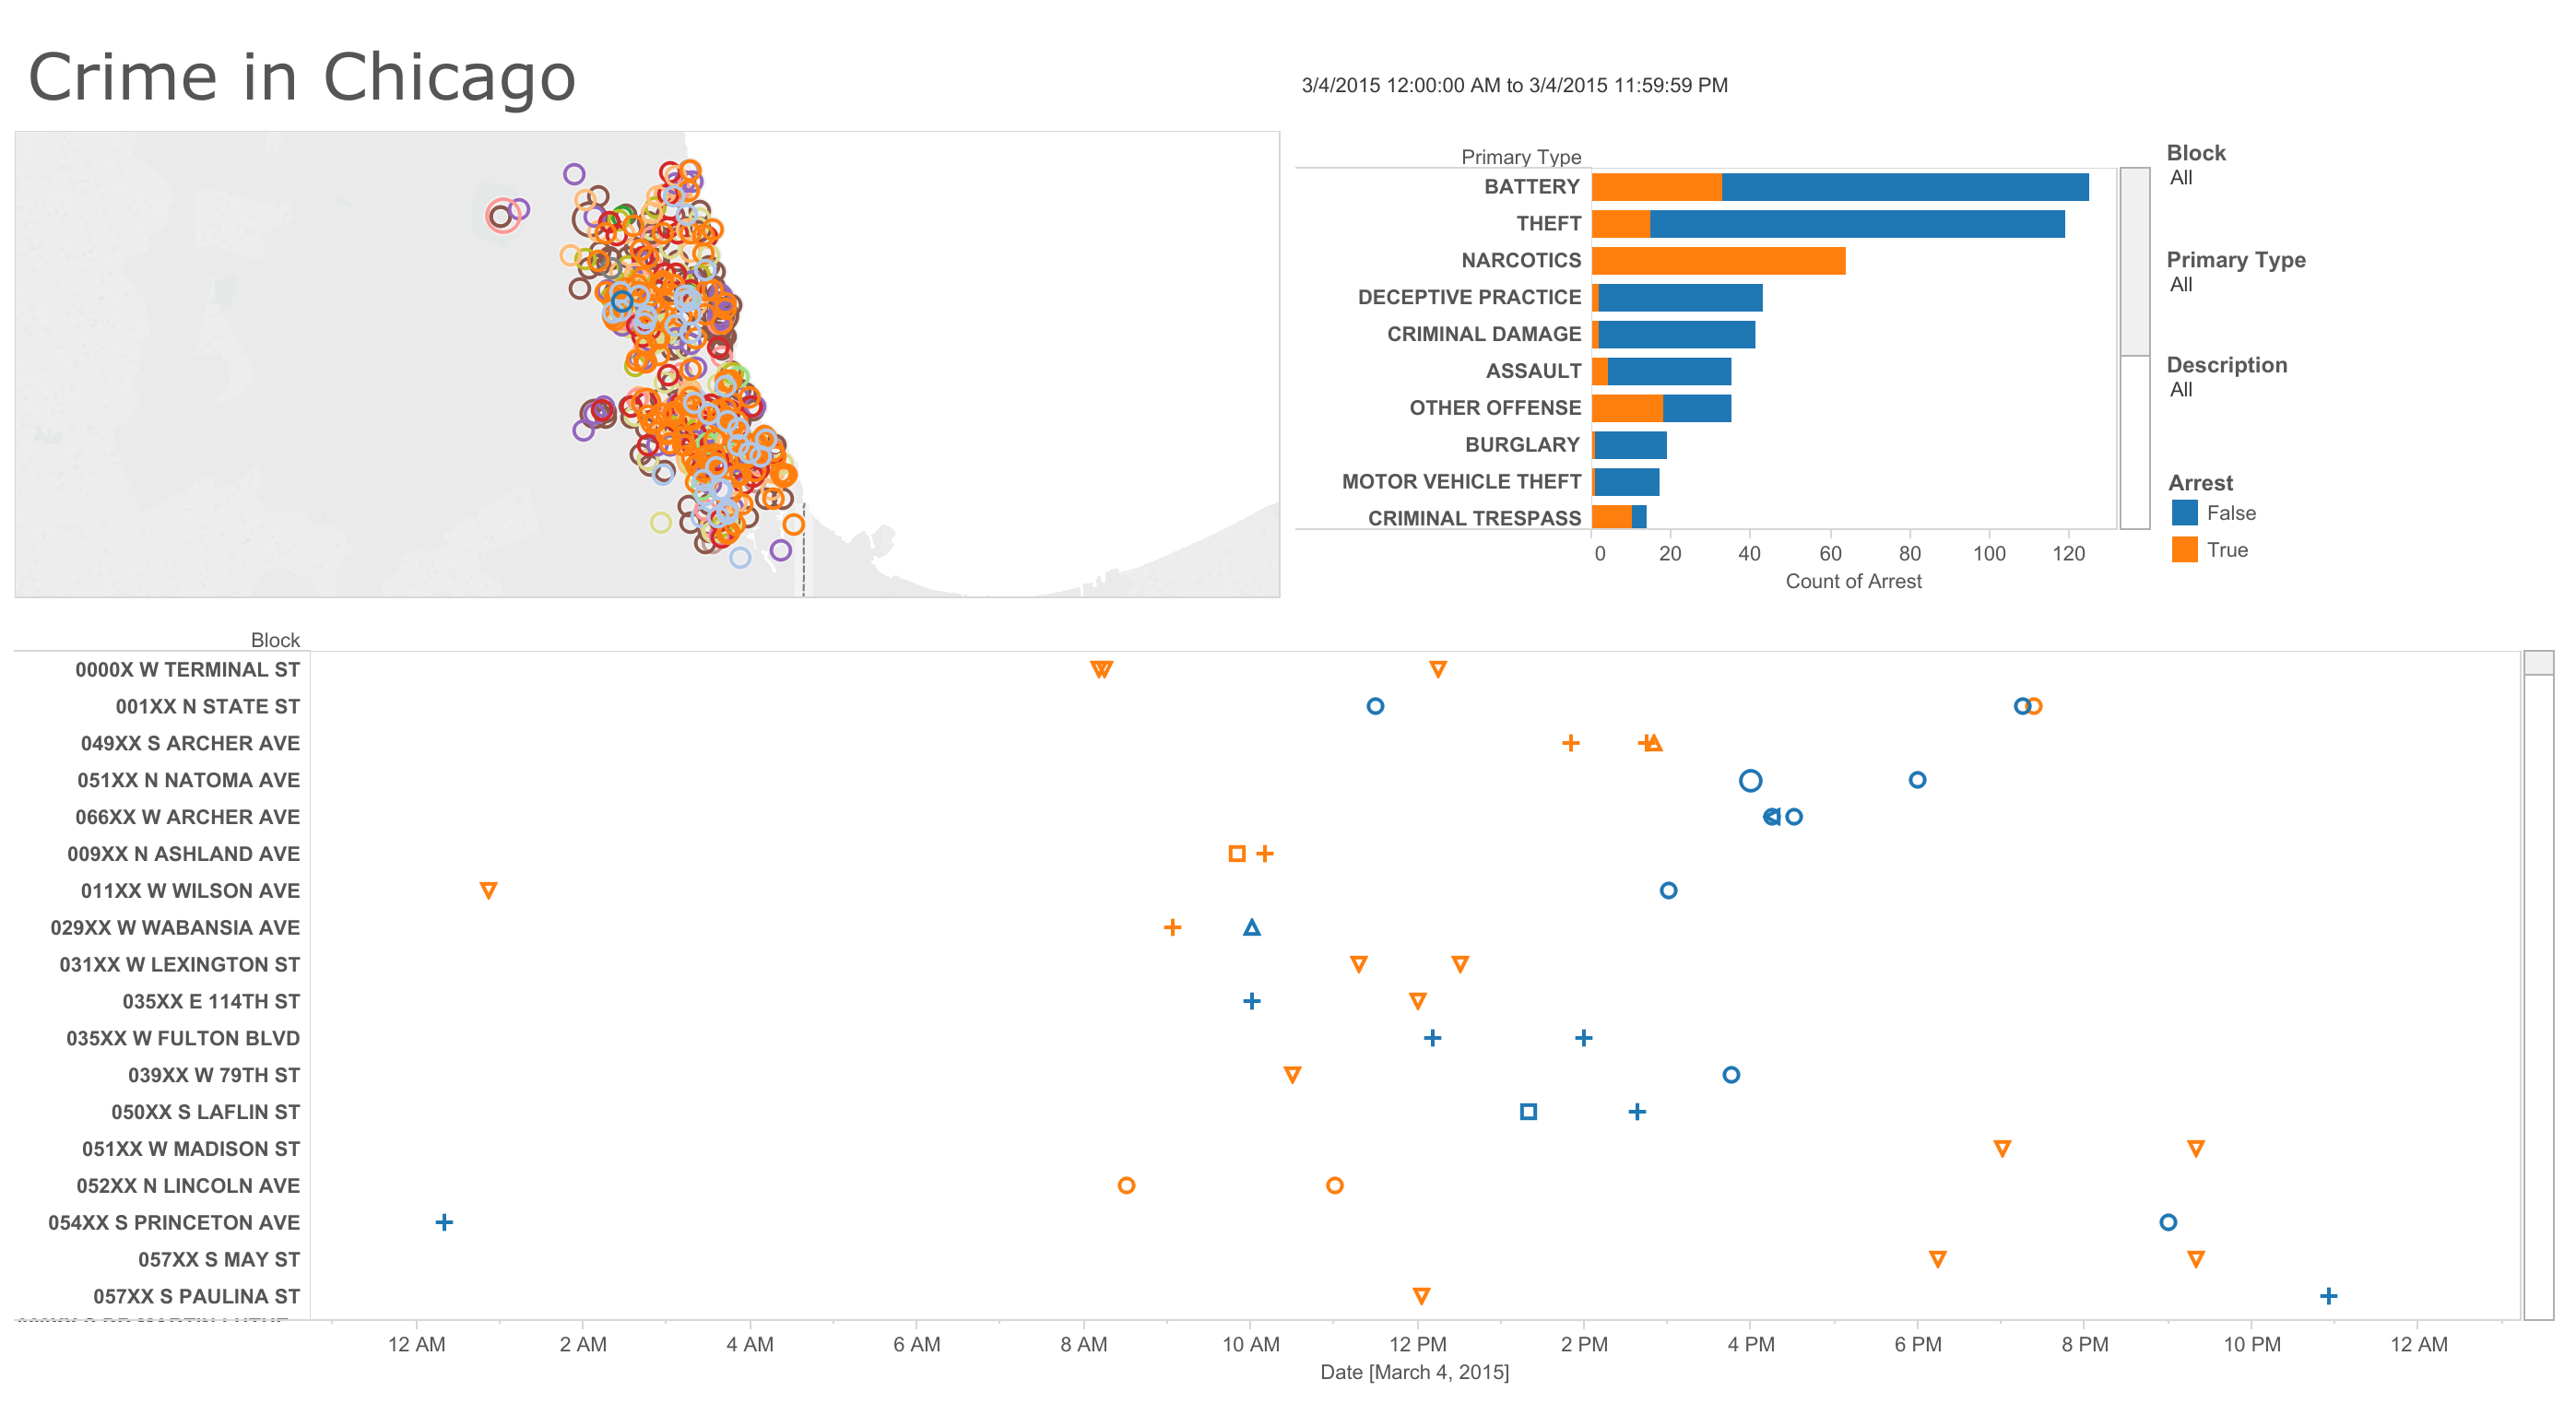
Chicago Crime Dashboard

This Chicago crime dashboard was created for a friend that was moving to Chicago. They wanted to find a safe neighborhood. This dashboard allows you to see what crimes happened on which blocks across all of Chicago. Feel free to find your favorite area of Chicago below.

Continue Reading  View Dashboard

Pilot Light Foundation

Pilot Light Foundation needed some web consulting projects completed. They wanted to transition away from the orginal developer, making updates to the site, and investigate why the site was crashing.

Continue Reading

Illinois Teaching Diversity

This Illinois teaching diversity dashboard was created to for Skokie School District 73.5 where I serve a Vice President of the School Board. There is an ongoing discussion regarding the diversity SD73.5 teaching staff. While the current staff is excellent, its diversity does not reflect the student population. This dashboard was created to compare the diversity of surrounding districts to see if this issue was unique to SD73.5. It is not. Feel free to interact with it on the right.

Continue Reading  View Dashboard

Delta County Historical Society

The Delta County Historical Society was in need of a site redesign and wanted to move to a content management system that would reduce the depedencies on web developers. I worked with the society to develop a Wordpress backend that would support their content and implemented a custom design. After a serise of trainings, the sociecty is competely self-sufficient.

Continue Reading  View Site

Illinois School Financials Dashboard

This Illinois school financials dashboard was created to for Skokie School District 73.5 where I serve a Vice President of the School Board. At the time of creation, Illinois was exploring new funding models that might have had a negative impact on the SD 73.5 budget. Feel free to interact with it on the right.

Continue Reading  View Dashboard

US Population Change Heatmap

Just for fun, I have been going through census data to see what information is contained in the data. This dashboard shows the population change from 2010 to 2017 and identifies the counties with the biggest change. Try selecting your state to see if your county is growing or shrinking.

View Dashboard